
 SpherifyerVirtualization Platform Reporting, Audit and Planning Tool
Your virtualization at a glance, with history instead of a snapshot.
Spherifyer talks directly to vCenter, periodically collects datastore, VM and host data and stores it as history. So you see not only how full a datastore is, but since when and how fast it is filling up. Support for Proxmox VE via the Proxmox Datacenter Manager is in development.
A VM fills up its datastore: Spherifyer sees the trend, warns in time and says what to do.
Direct vCenter access, no PowerCLI
Native access to the vSphere API. No PowerCLI, no PowerShell, no add-on modules on the server.
History and trends
Collection runs at a fixed interval, stored in an embedded database. You decide how long data is retained.
Seven views
Storage, VMs, hosts with CPU and vCPU load, topology, warnings, history and planning. Tables can be filtered and sorted.
Warnings with recommendations
Overfilled datastores, overprovisioning, bottlenecks and gaps in hardening are detected and come with a concrete recommendation.
Terminal and service
Terminal interface with live status and event log. Installs as a Windows service directly from the interface.
Open HTTP API
Report, status and time series as JSON for monitoring, scripts or your own intranet.
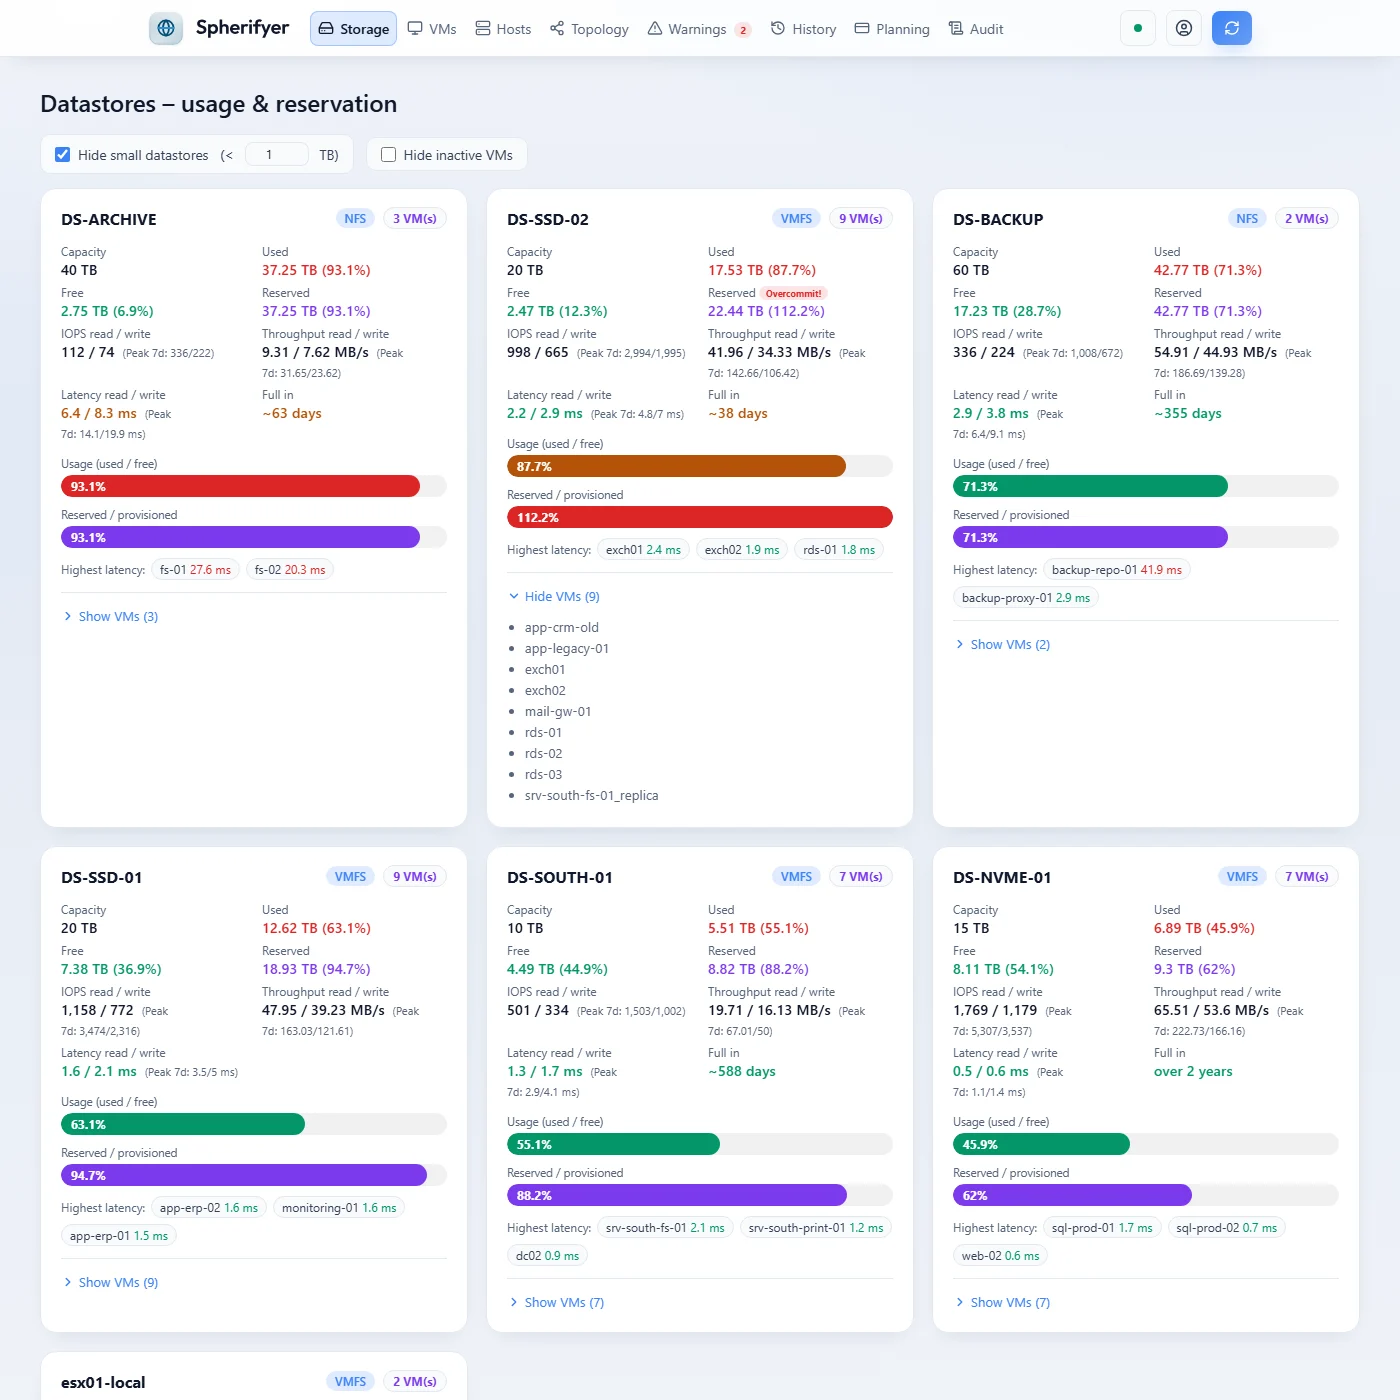
Every datastore with usage, overprovisioning, IOPS, throughput and latency, plus the peaks of the last seven days and the VMs on it.
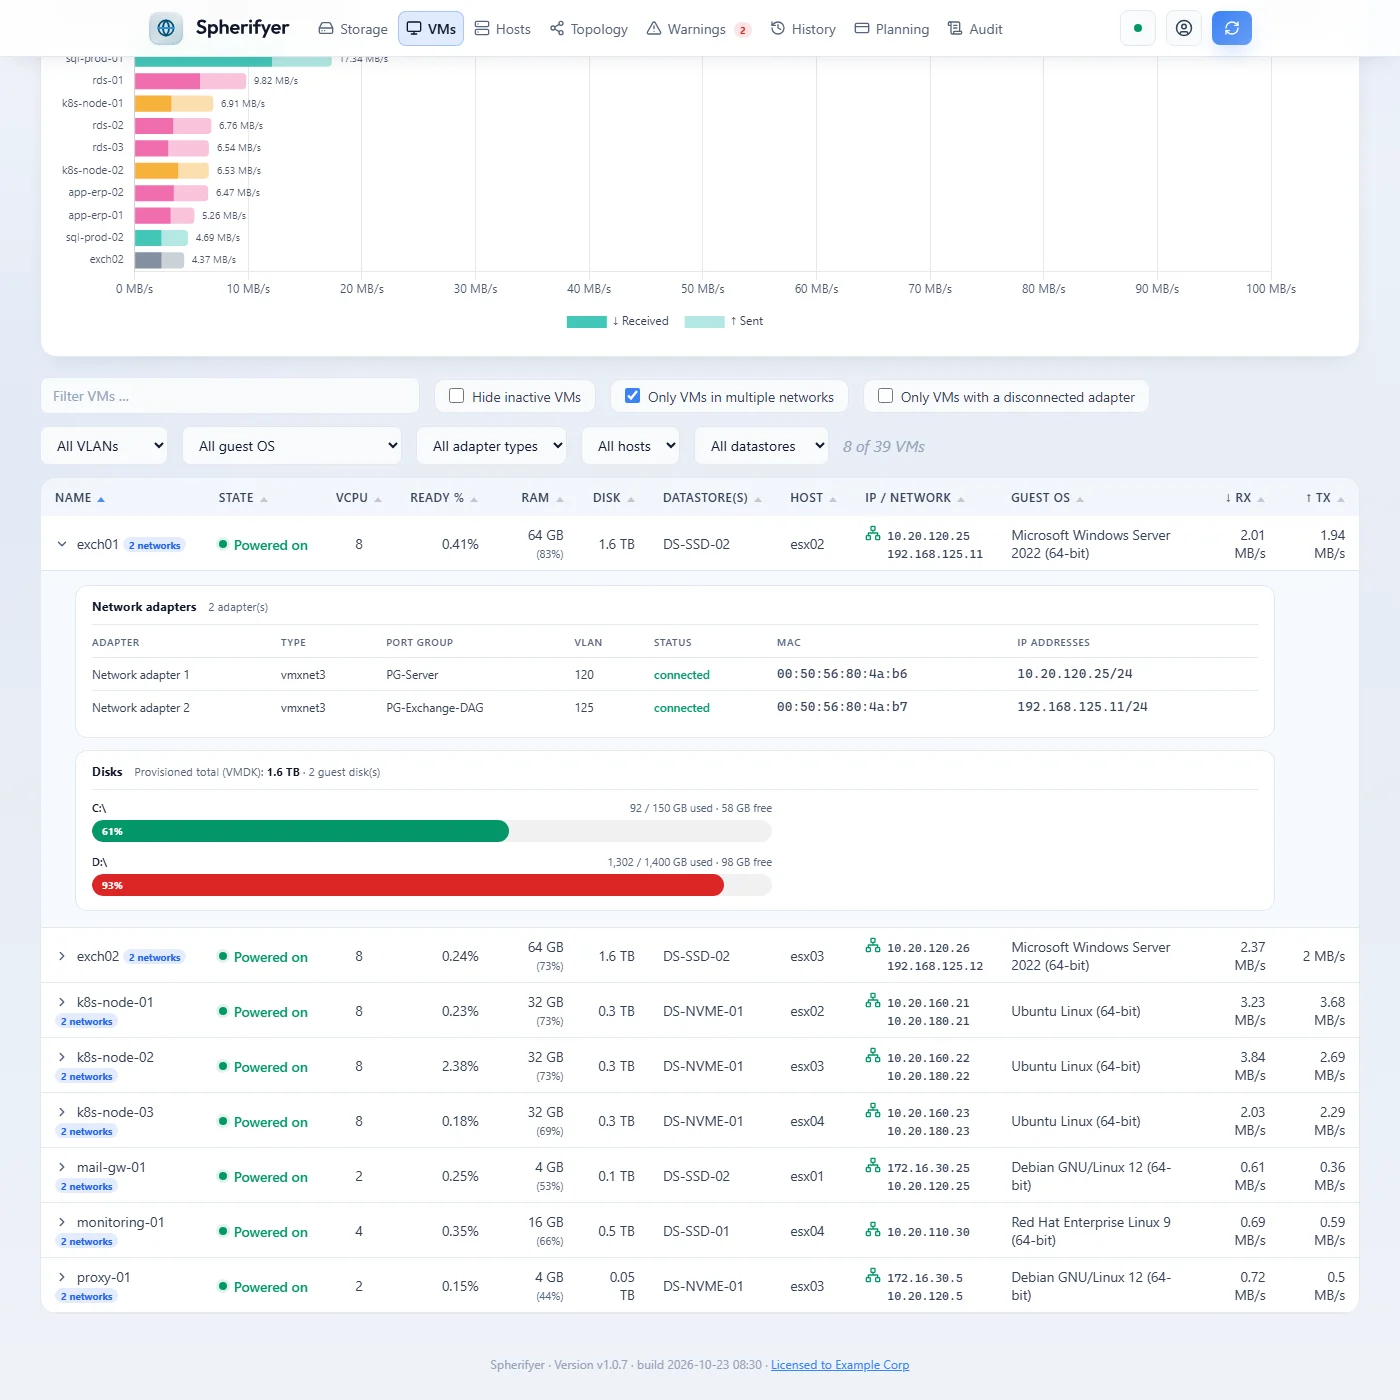
Filtered to VMs in several networks. Expanded, each VM shows its network adapters with port group, VLAN, MAC and IP addresses and the usage of its guest disks.
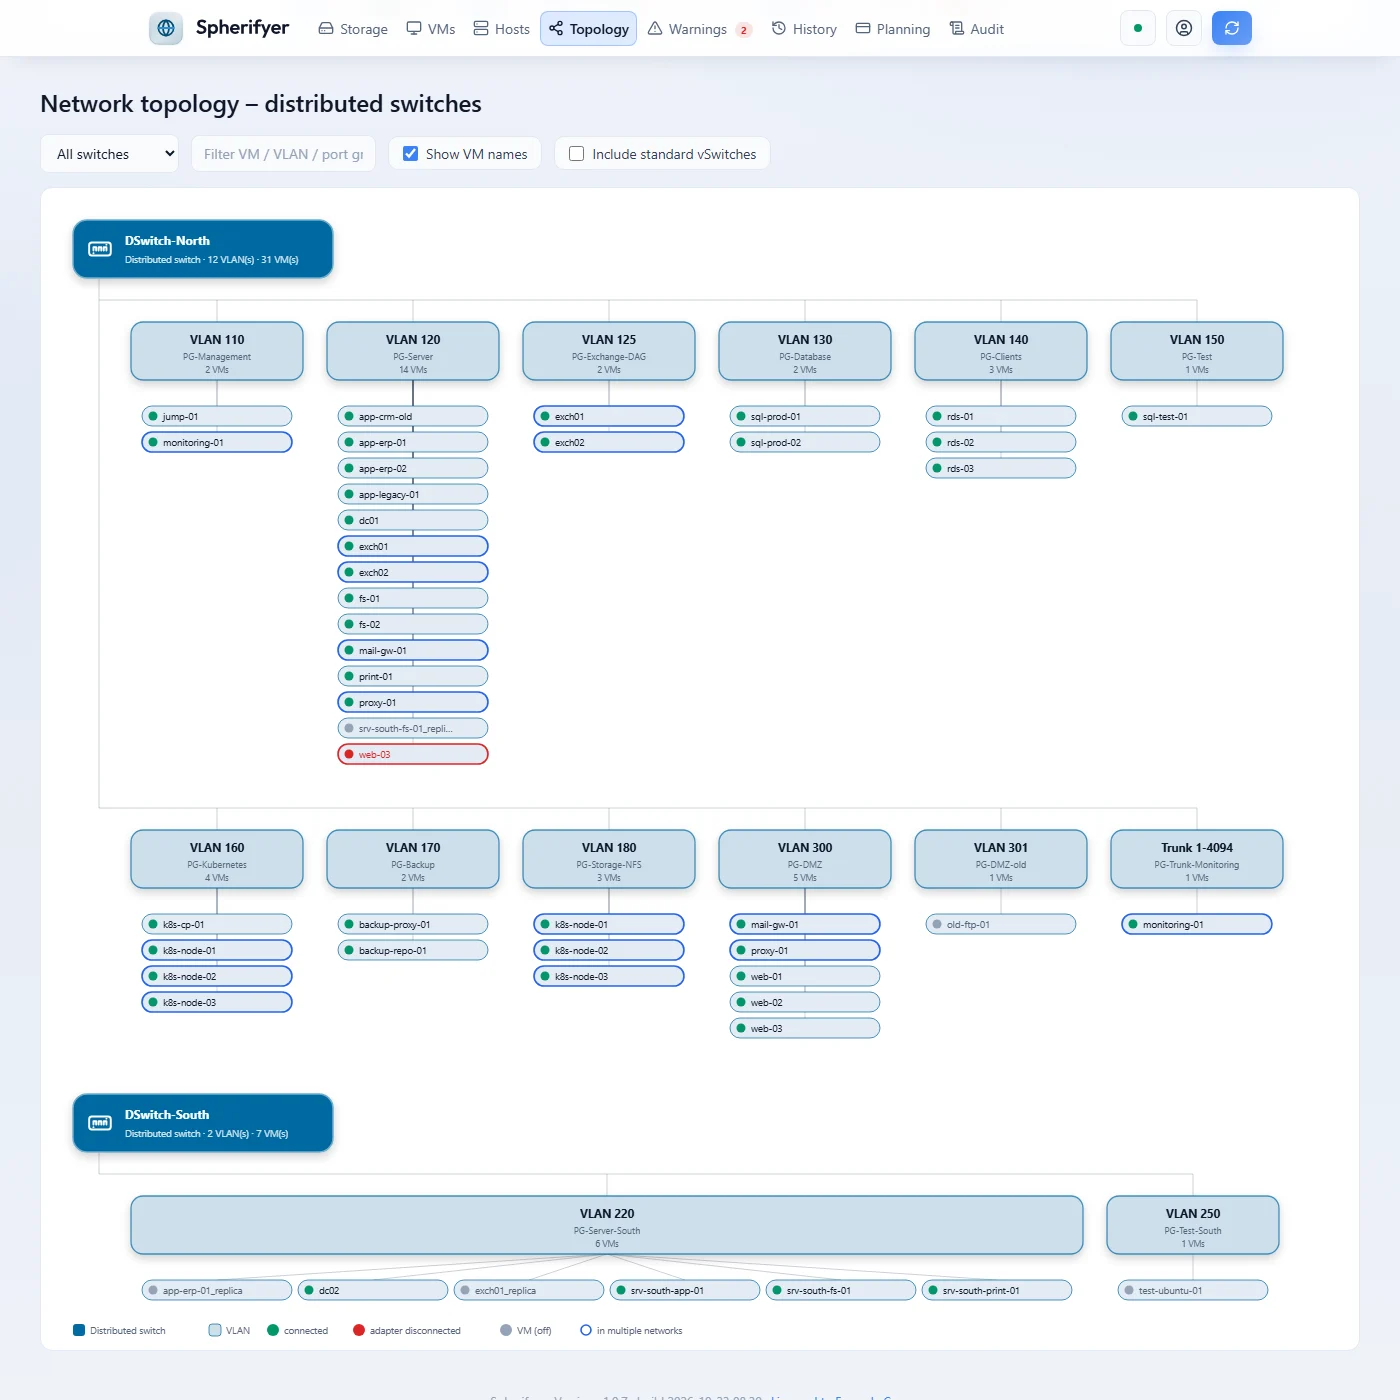
Which VM is attached to which VLAN, per distributed switch. VMs in several networks are outlined, disconnected network adapters marked in red.
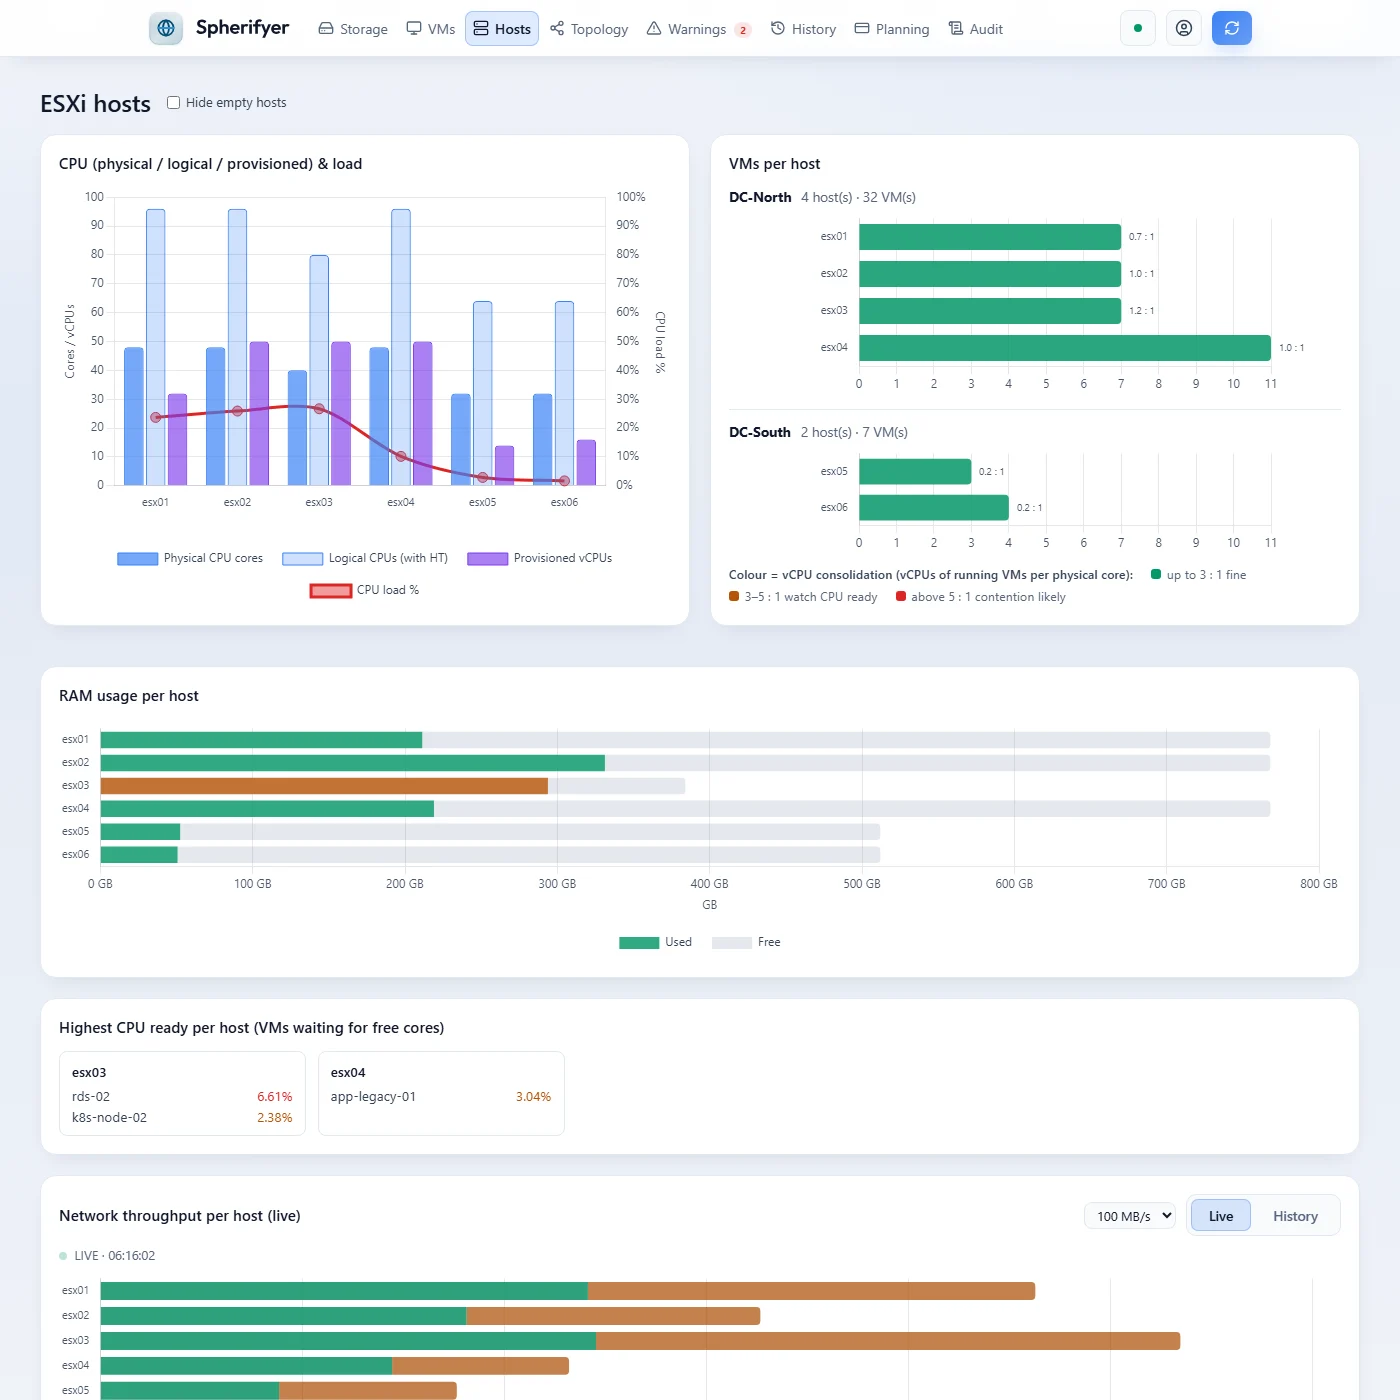
RAM usage per host and network throughput in real time, switchable to history.
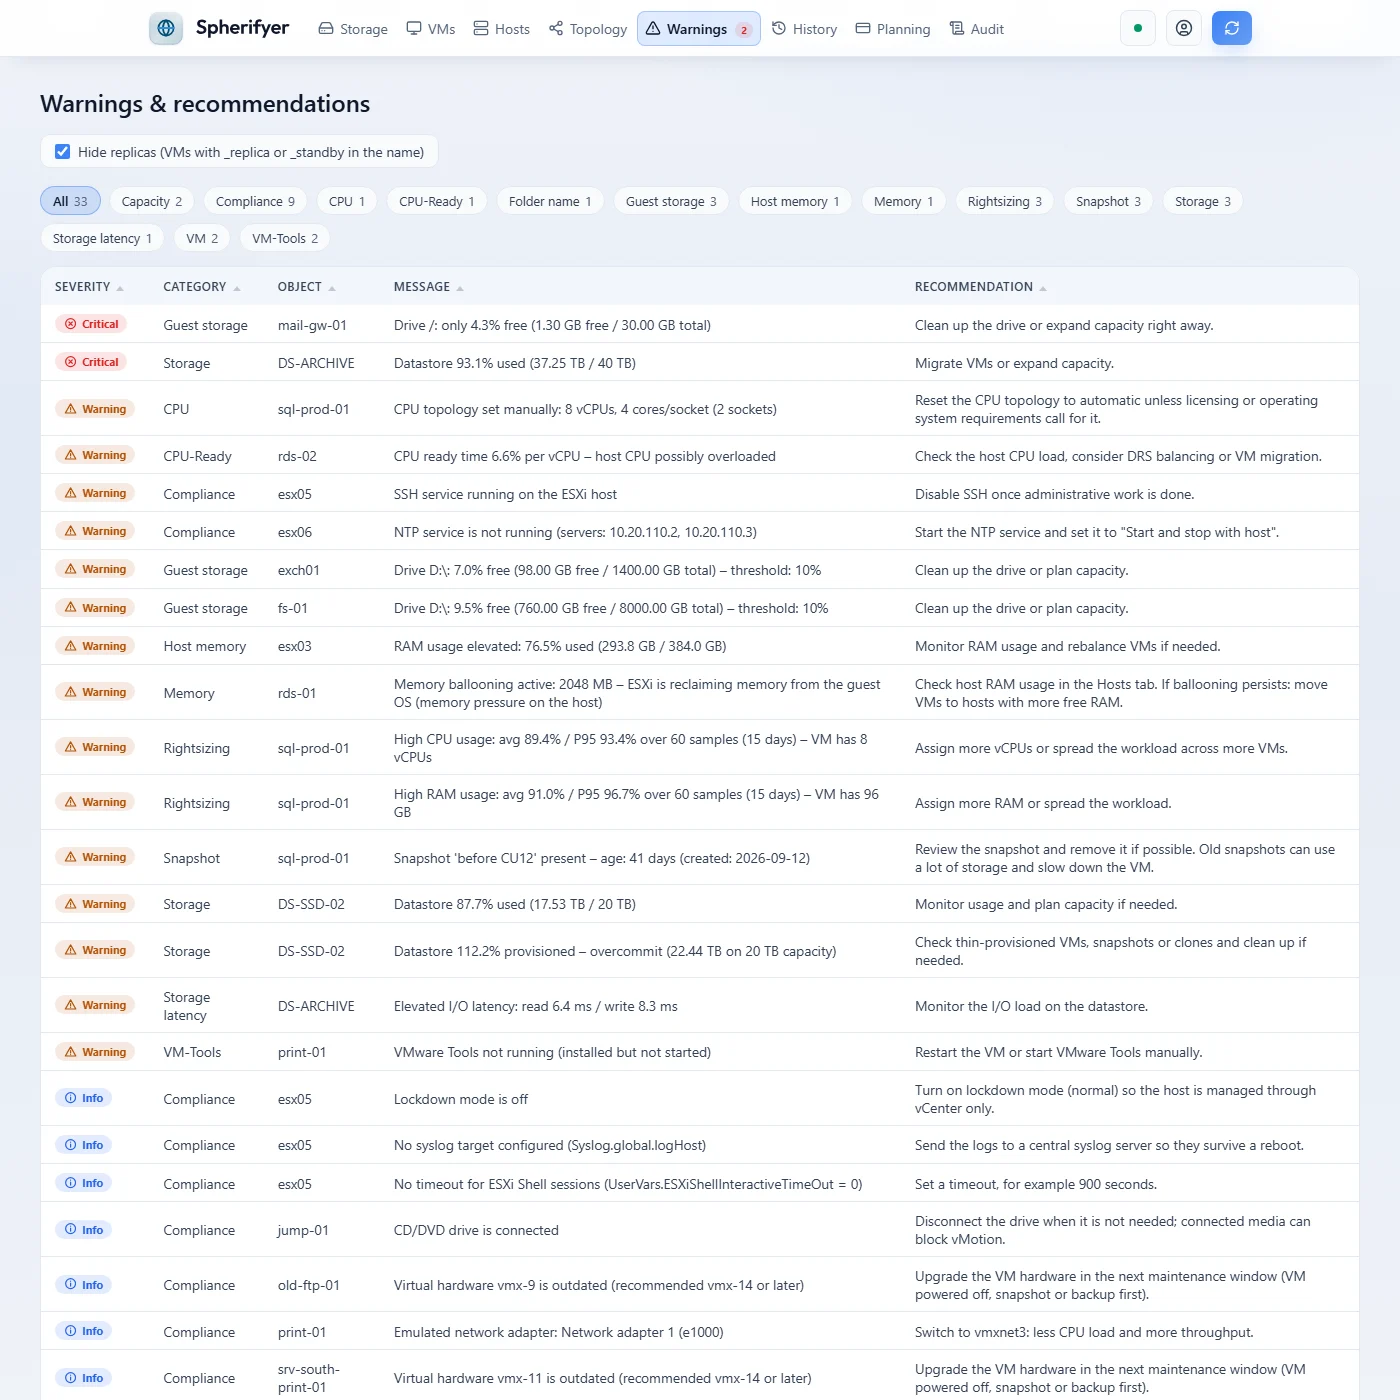
Warnings by severity, each with a concrete recommendation. Rightsizing is based on the history of the last 14 days.
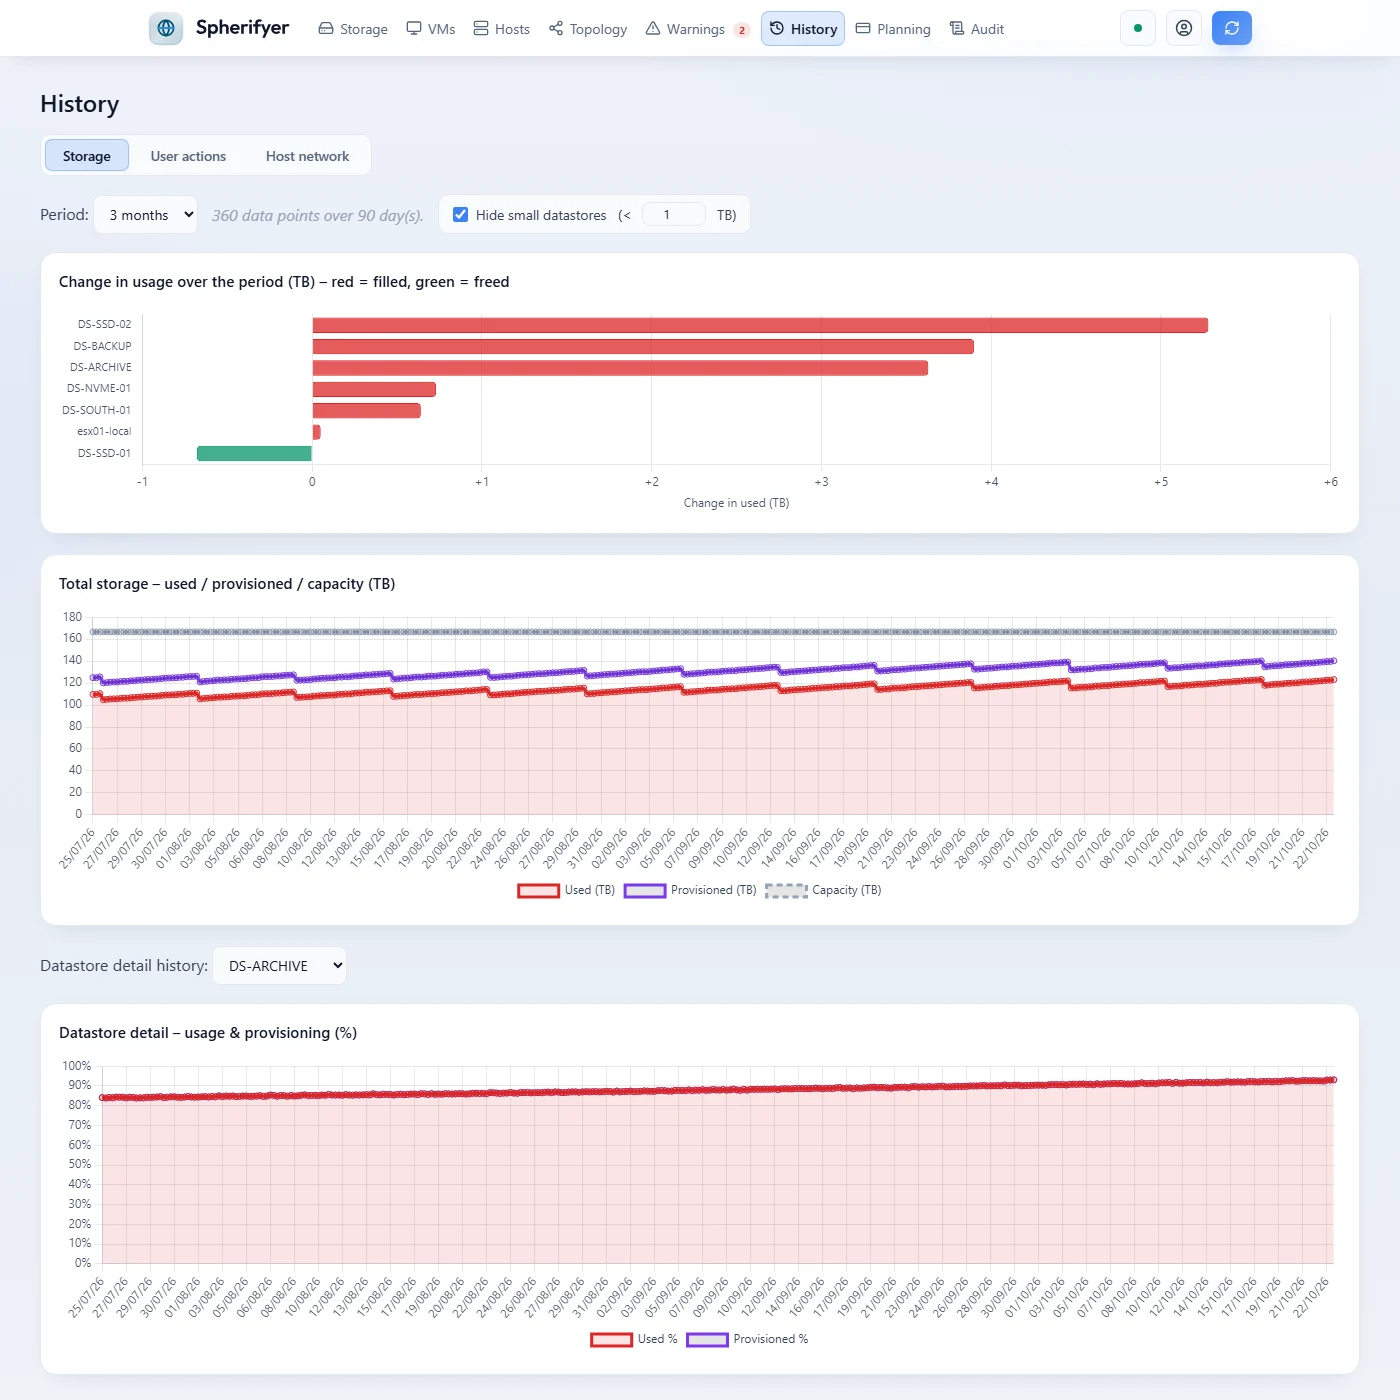
Three months at a glance: which datastore has grown, which was cleaned up and how total storage is developing.
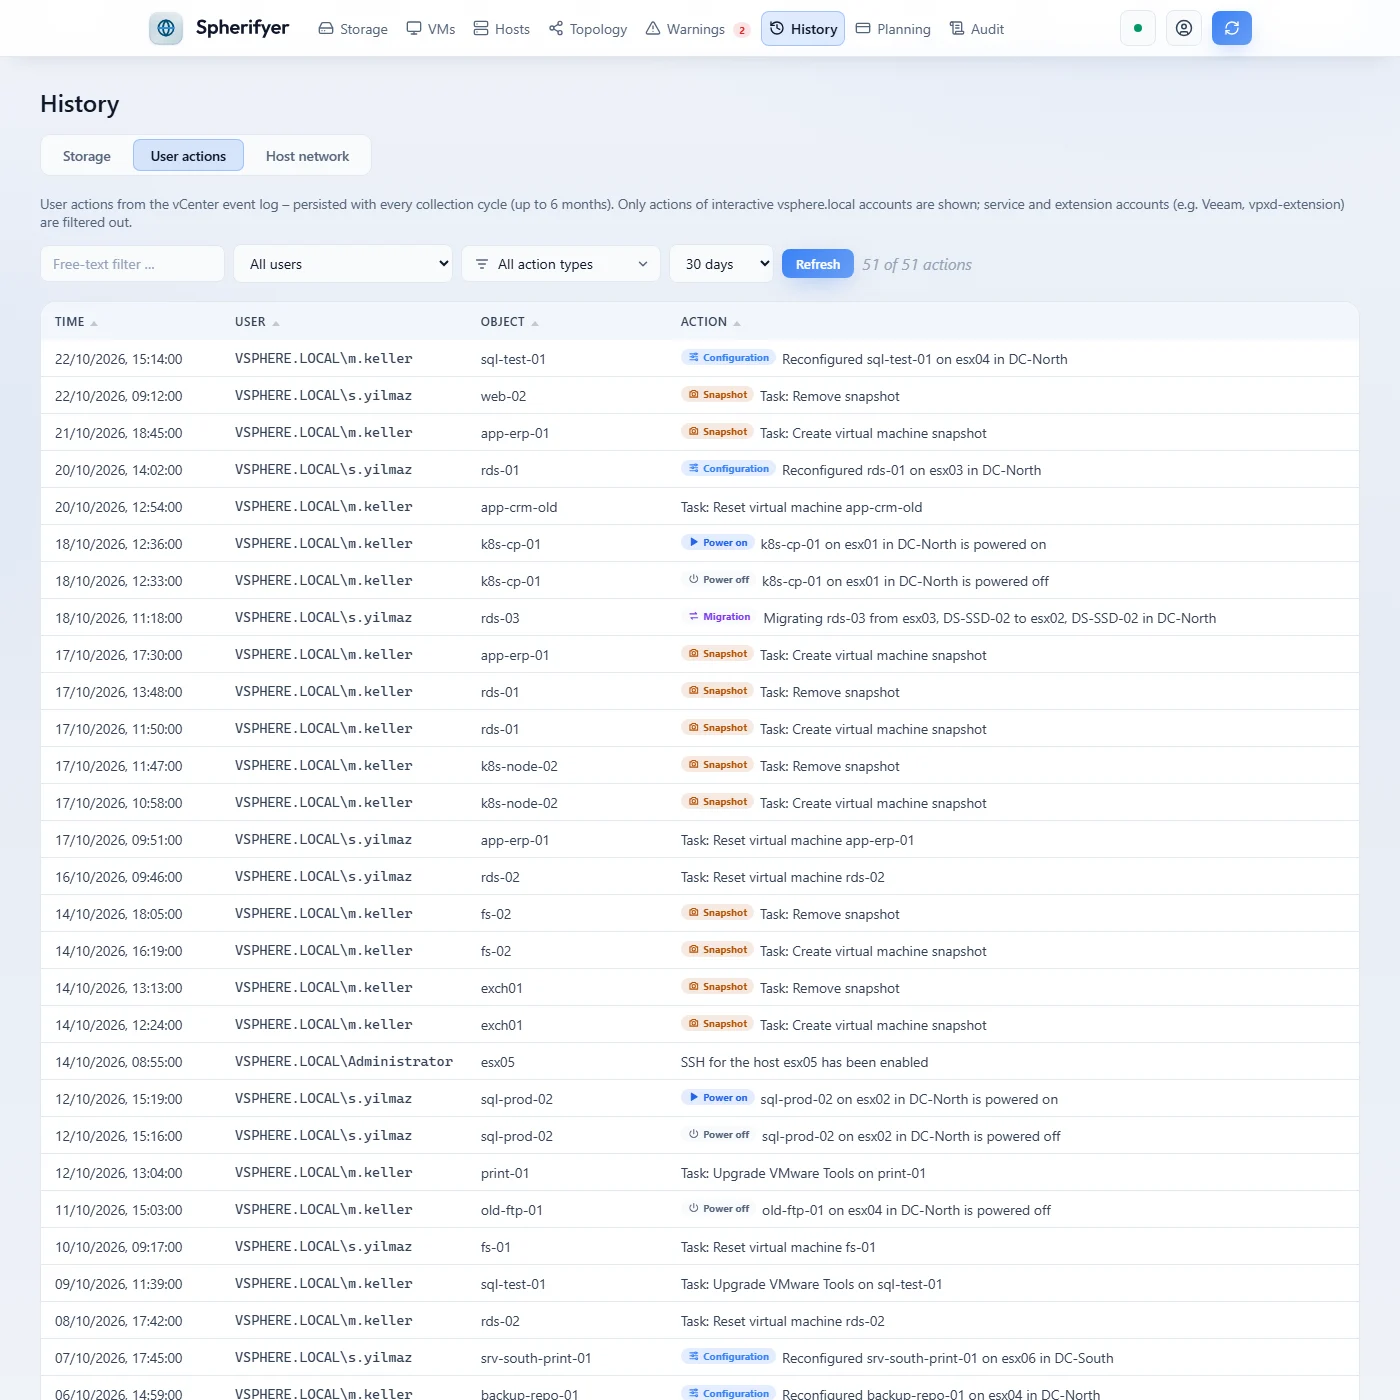
Who created a snapshot, reconfigured or migrated a VM, and when: the vCenter event log, filterable by user and action type.
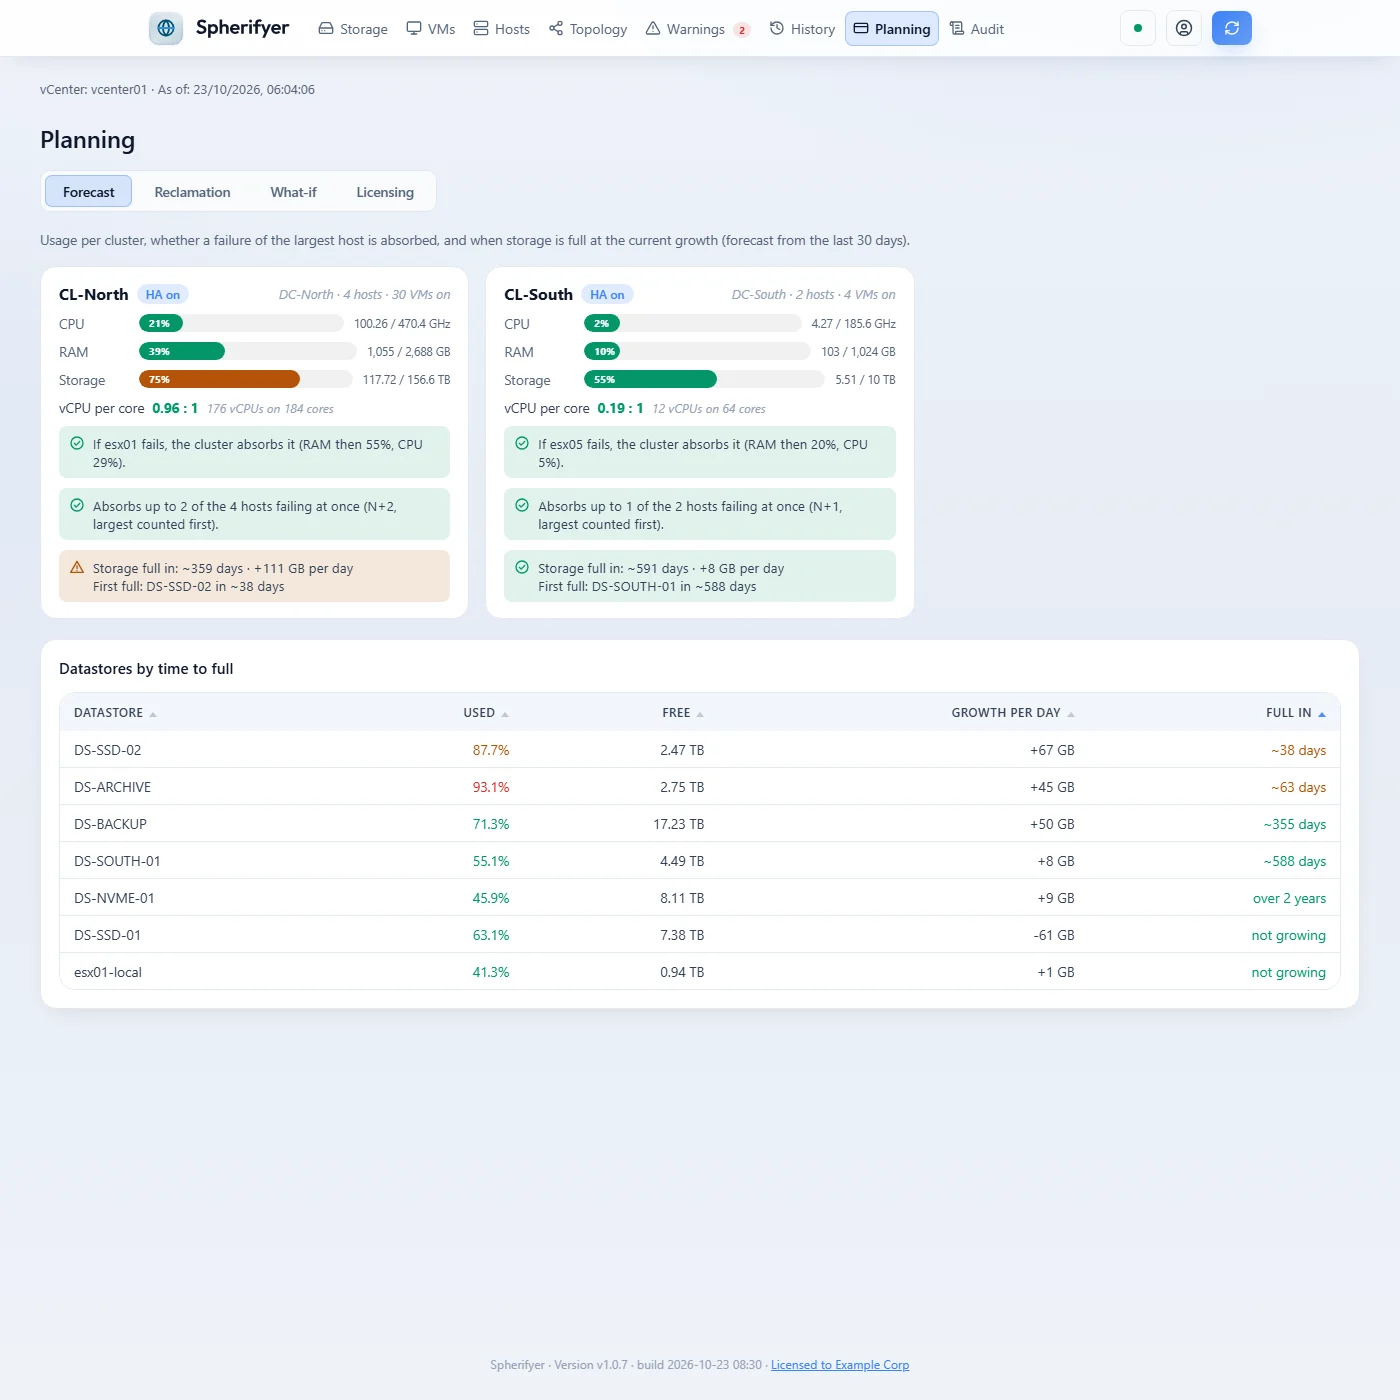
Per cluster: usage, whether a failure of the largest host is absorbed, and when storage is full at the current growth.
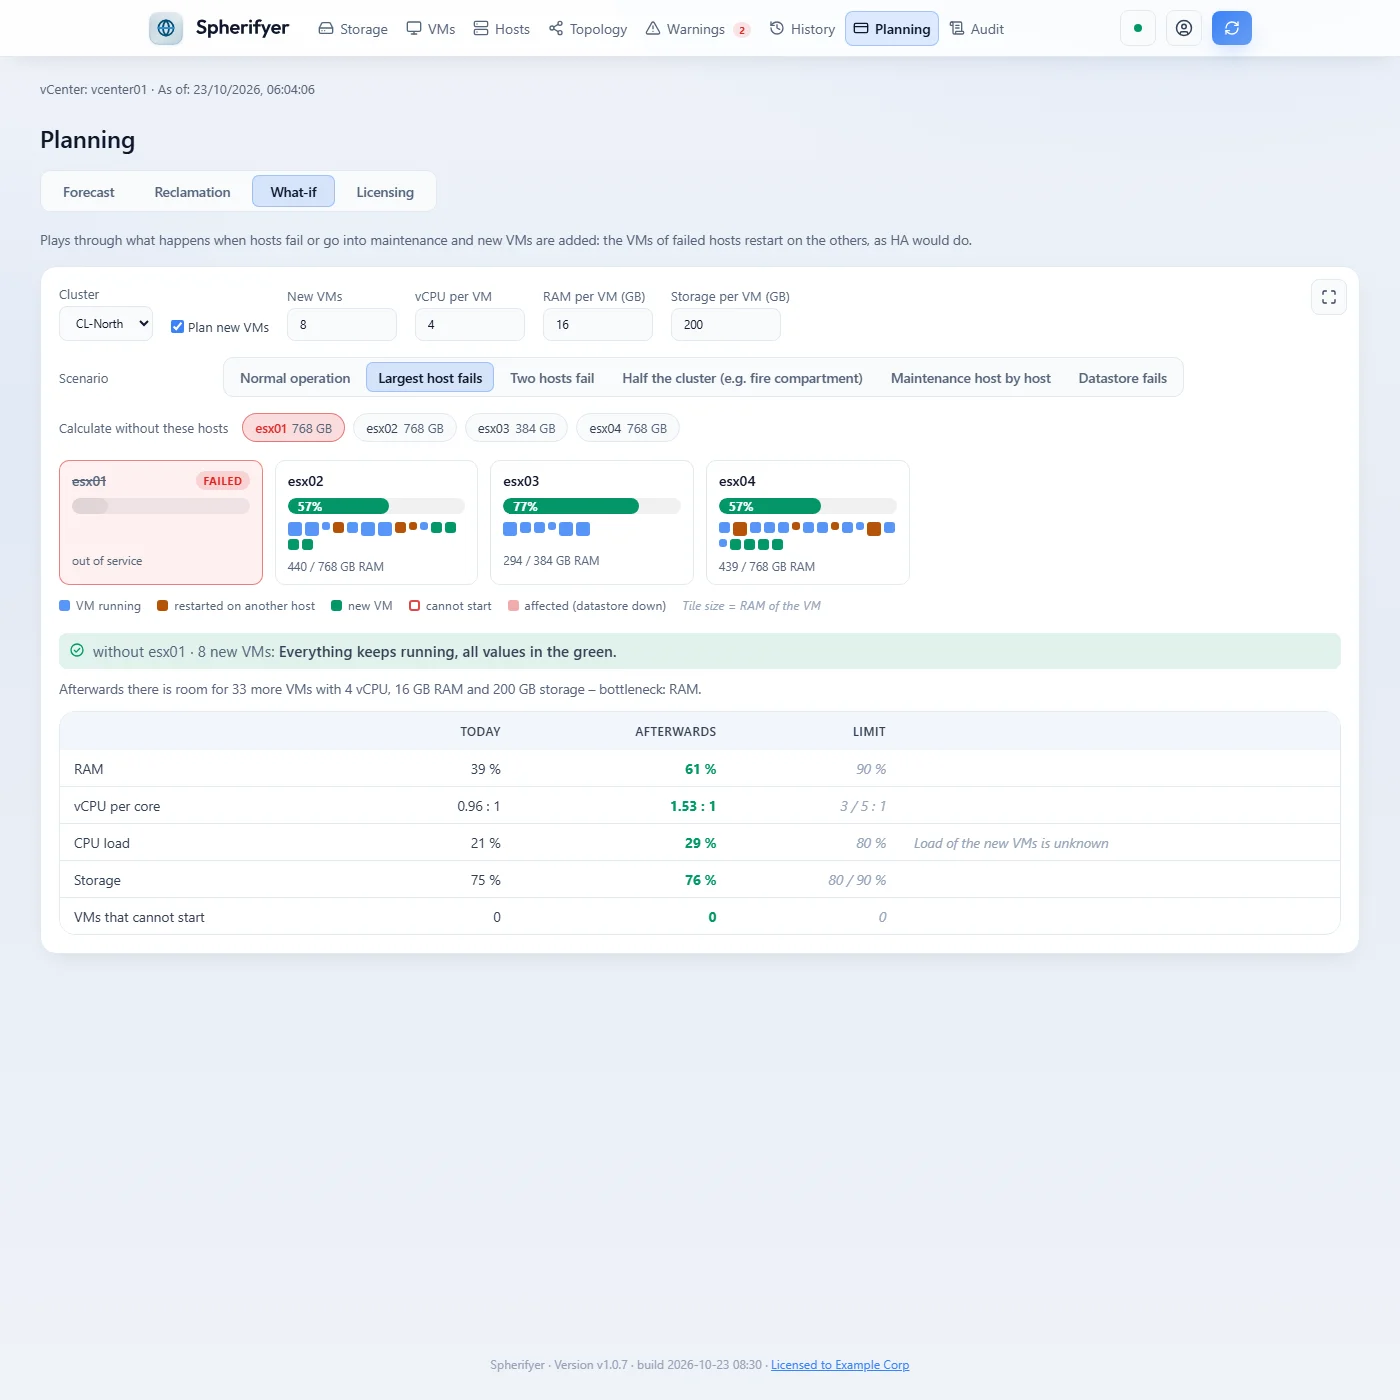
The largest host fails: its VMs restart on the others, plus eight planned VMs. Below, the verdict, how much still fits and the limits.
What happens when a host fails?
The failure simulation plays through disasters on your real inventory: hosts fail or go into maintenance, and their VMs restart on the other hosts, as HA would do. You see which VMs move where, which host fills up and what no longer finds room anywhere.
Spherifyer also names the reason when it gets tight, how many hosts a cluster may lose at once (N+k) and how many new VMs still fit afterwards.
- Disaster examples
- Largest host, two hosts, half the cluster (for example a fire compartment), maintenance host by host with the tightest moment, datastore fails, or hosts of your choice.
- Current state or plan
- By default the simulation uses the current state. On request it adds planned VMs with size and count.
- Whole sites
- In the topology a click fails hosts, clusters, datastores or a whole datacenter. VMs restart as with HA only within their own cluster. If a whole site fails, they start in the free RAM of the other one. VMs on a failed datastore stop, including those on local disks of a failed host. Animated, showing where each VM goes and which ones stay down.
- Full screen
- Map and topology can be maximised in the browser, for example for a meeting with management or emergency planning.
The whole environment in one view instead of object by object.
The vSphere Client shows the current state. To see it, you usually click through the inventory: one VM, one host, one datastore after another.
Spherifyer summarizes all datacenters in one view each, evaluates their state and keeps it. Every collection run is stored, turning snapshots into trends.
- Everything in one table
- All datastores, VMs and hosts, sortable and filterable, for example by VLAN, host, datastore, guest operating system or network adapter type.
- Topology
- Which VM is attached to which VLAN and port group, as a topology per distributed switch. VMs in several networks and disconnected network adapters stand out immediately.
- Assessment instead of raw data
- Warnings with recommendations on usage, overprovisioning, latency, old snapshots, full guest disks, VMware Tools, incorrectly sized VMs and items from the vSphere Security Configuration Guide (lockdown mode, NTP, syslog, SSH, outdated VM hardware). Categories can be filtered, replicas hidden.
- Snapshots
- All snapshots in the environment with age, size and level in one list.
- User actions
- The event log is stored with every collection run and is kept even after vCenter deletes its events at the end of its retention period.
- Planning
- Capacity per cluster and whether it absorbs a failure of its largest host, a forecast of when storage is full, what-if for new VMs and a reclamation list: long powered-off VMs, idle VMs and old snapshots, optionally with an estimated saving. Plus CPU sockets and cores per datacenter and host for license planning.
See where your storage is going.
Every collection run records usage, provisioning, IOPS, throughput and latency of each datastore. In the history view you choose a period from 30 days to more than two years, limited only by the configured retention (default 90 days).
This answers questions a snapshot leaves open: Which datastore is growing fastest? Did last month's cleanup make a difference? Will capacity last until the next investment?
- Change over the period
- Per datastore, how much was added and how much was freed. Growing datastores and cleanups are visible immediately.
- Total storage
- Used, provisioned and capacity of the whole environment as a curve, for capacity planning and budgeting.
- Detail per datastore
- Usage and provisioning in percent over time. Thin provisioning that slowly fills up becomes visible before space runs short.
- History per VM
- CPU as average and peak between two collection runs, RAM, the space used on the datastore and every guest disk over time. Plus the VMs that grew most and a forecast of when a guest disk will be full.
- Performance
- Peak values for IOPS, throughput and latency over the last seven days on every datastore card.
- Custom analyses
- All time series as JSON via the HTTP API.
- 01
Connect
Enter the vCenter address and credentials, choose the collection interval.
- 02
Collect
Spherifyer periodically reads datastores, VMs and hosts.
- 03
Analyze
Dashboard, history and warnings show the current state and how it develops.
- 04
Act
Apply recommendations before a datastore fills up.
vCenter report without PowerCLI
VMs, datastores, hosts and networks of all datacenters in one view, with history, audit and user actions.
Learn moreMonitor datastore usage
When will the datastore be full? Forecast, overcommitment, latency and old snapshots, with warning and recommendation.
Learn moreCapacity planning with failure simulation
HA reserve and N+1 per cluster, play through host and site failures, find oversized VMs.
Learn moreCheck ESXi hardening
SSH, lockdown mode, NTP, syslog and VM hardware per the vSphere Security Configuration Guide, after every collection.
Learn moreDocumentation
Installation, vCenter setup, views, every warning with thresholds, settings and API.
Open the documentation- Platforms
- Windows and Linux, a single executable
- Requirement
- Network access to the vCenter Server · For updates, outbound HTTPS to www.wedigo.net, directly or via a proxy (taken over from the Windows settings or set in the dashboard and the console), can be switched off
- Data storage
- Embedded database, configurable retention
- Login
- Local admin with initial password and mandatory change, passwords hashed with Argon2id, two-factor code (TOTP) · Windows accounts through AD/LDAP, access by group or OU · Audit log of all changes in the dashboard
- Interfaces
- Web dashboard in German and English, light and dark, all settings there too · terminal interface
- Default address
127.0.0.1:8080, freely configurable- HTTPS
- On the same port, switched without a restart: with your own certificate files or with a certificate from Acmefyer that Spherifyer fetches itself and has renewed
- Updates
- Automatic self-update from signed releases, optionally within a maintenance window. If a new version does not start cleanly, the service returns to the previous version on its own. Can be switched off or set to notify only.
Between an Excel export and a monitoring suite.
For an overview of a virtualization environment, many people use an inventory export or a large monitoring suite. Spherifyer sits in between: one program that collects regularly, keeps the history and assesses the state.
- Inventory export
- For example RVTools or PowerCLI scripts. They deliver an accurate snapshot, usually as an Excel sheet. Spherifyer collects at a fixed interval and stores every run, so you can compare states and read trends, in the browser instead of in spreadsheet files.
- vSphere Client
- Shows the current state object by object, and events only until the end of their retention period. More under Overview.
- Monitoring suites
- For example VCF Operations (formerly Aria Operations or vRealize Operations), Veeam ONE, PRTG or Zabbix. They monitor comprehensively and alert in real time, but usually run as a dedicated appliance or with their own database server. Spherifyer is a single executable with an embedded database and focuses on reporting, audit and planning.
- License planning
- Since VMware is licensed per CPU core as a subscription, every core counts. Spherifyer shows sockets and cores per datacenter and host as a basis, without an additional tool.
- Proxmox Datacenter Manager
- Manages many Proxmox clusters in one place, with a current overview and key figures. Spherifyer will build on it and add history, assessment with recommendations, and capacity and subscription planning, see Proxmox.
Next up: Proxmox VE.
Spherifyer will also analyze Proxmox VE. It connects once to the Proxmox Datacenter Manager and sees all clusters managed there, with the same views, history and warnings as for VMware vSphere.
If you are moving from VMware to Proxmox or run both, you will see both platforms side by side: what still runs on vSphere, what already runs on Proxmox, and which licenses and subscriptions that requires.
Spherifyer stays free for that too.
- Connection
- One read-only API token on the Proxmox Datacenter Manager. For data the Datacenter Manager does not provide (guest disks, IP addresses, exact storage allocation), an additional read-only token per cluster. Spherifyer needs no write permissions.
- Analyses
- Storage, VMs and LXC containers, nodes, network with bridges and VLANs, snapshots, history, warnings with recommendations and user actions from the task log.
- License planning
- Proxmox subscriptions per CPU socket with level and due date, next to the core requirements for VMware.
- Requirement
- Proxmox Datacenter Manager 1.0 or later, Proxmox VE 8.4 or later
- Status
- In development. What is described here is planned and may still change before release.
Spherifyer
- All features, any number of datastores, VMs and hosts
- No license key, no activation, no limits
- Updates included, automatic if you like
- Proxmox VE via the Proxmox Datacenter Manager to follow, free as well
- From the makers of Acmefyer, our certificate manager for your own network
SHA-256 checksums
Windows setup: f2ecd2c76c30994ec9db16a373858a216d67c05b37af2d40a4b183463d34a696
Windows program file: 4266154ecb6a11aa7dd657aef0cfca130a5cd116c1d7d552d0b9d8b67119d12f
Linux: 153bfb568112015b082399e4267a054ba2b80b959faec5cb43d206e0b60148f8